What is OEE Software?
OEE software automatically measures Overall Equipment Effectiveness — the combination of Availability, Performance and Quality — for every machine, line and shift. Instead of reconstructing OEE by hand at the end of the week in Excel, machine data is captured the instant it happens and turned into a live, trustworthy OEE score.
For manufacturers in Austria, Germany and Switzerland, this means less time spent chasing numbers and more time acting on them: spotting the machine dragging down a line's OEE, comparing shifts fairly, and proving the impact of improvement projects with real data.
What hopit's OEE Software Gives You
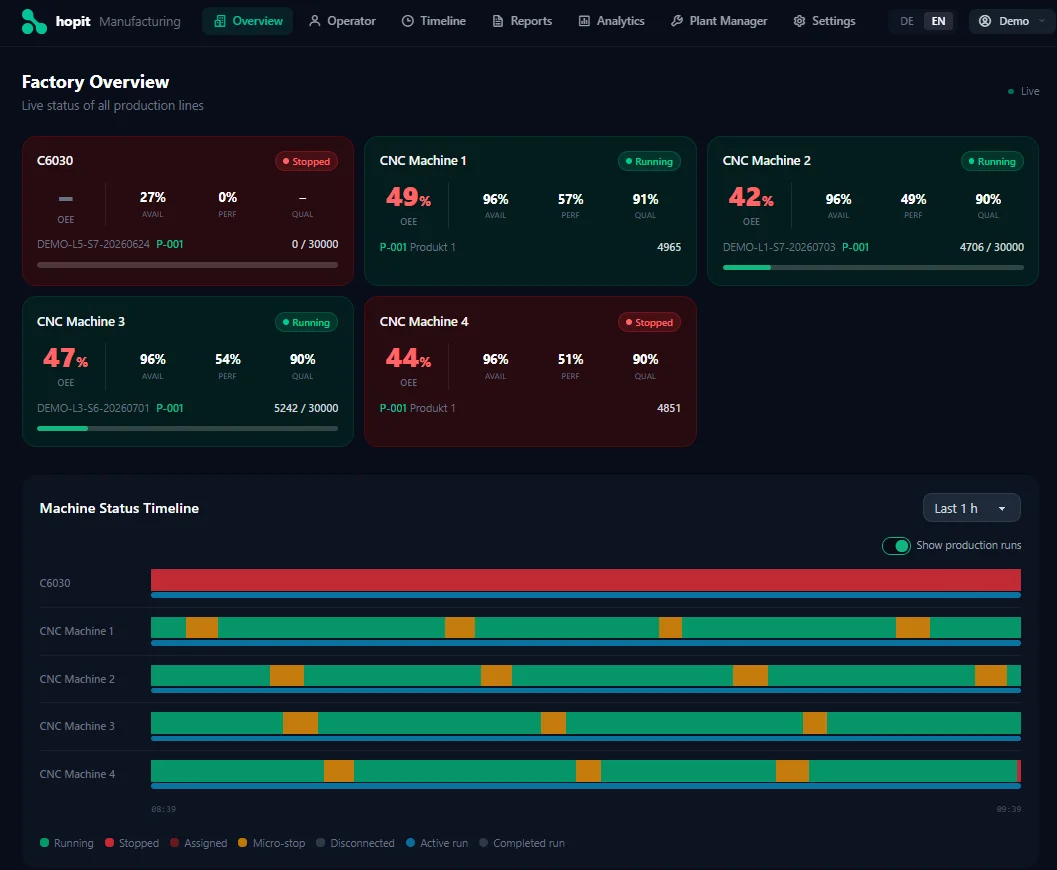
Factory-Wide OEE at a Glance
See the live OEE, Availability, Performance and Quality of every machine on one screen, so you always know which line needs attention first.
- ➔ No manual rollups: Factory-wide OEE is calculated automatically, not assembled from separate spreadsheets.
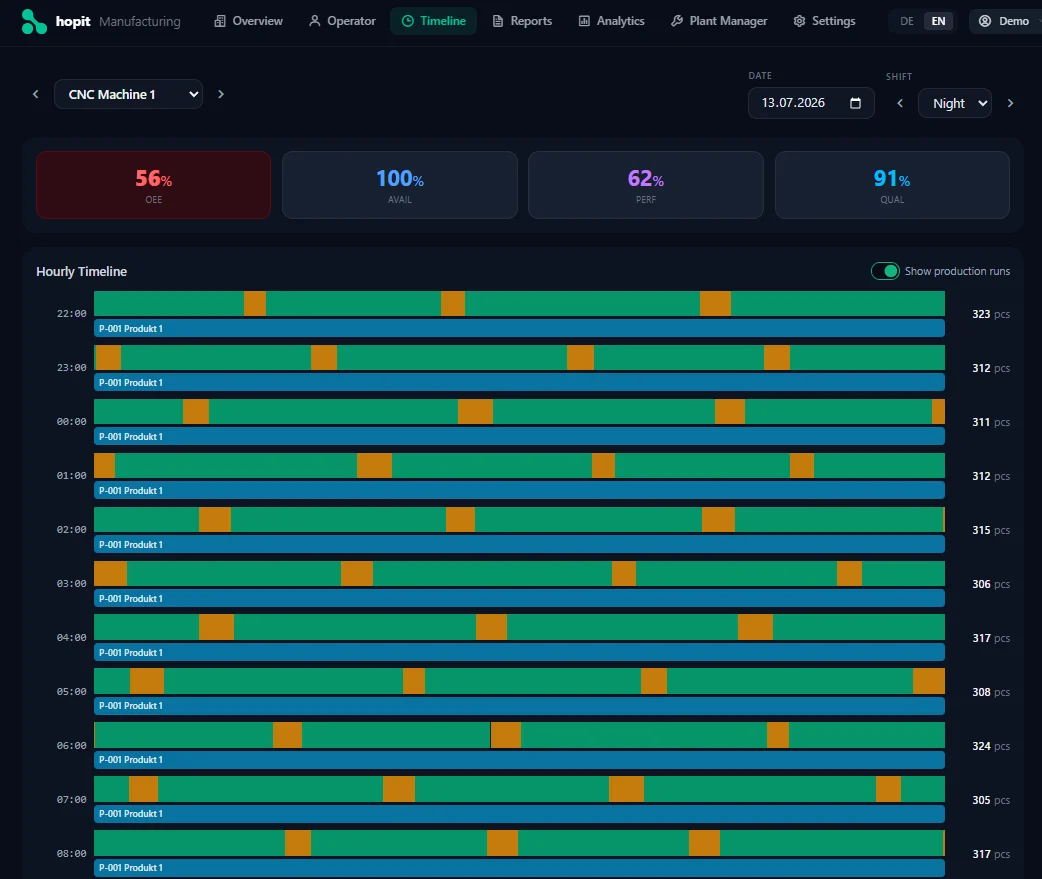
Per-Machine OEE Breakdown
Drill into any machine to see Availability, Performance and Quality hour by hour, alongside the exact stops and micro-stops behind the number.
- ➔ Root-cause ready: Every OEE dip links back to the downtime event that caused it.
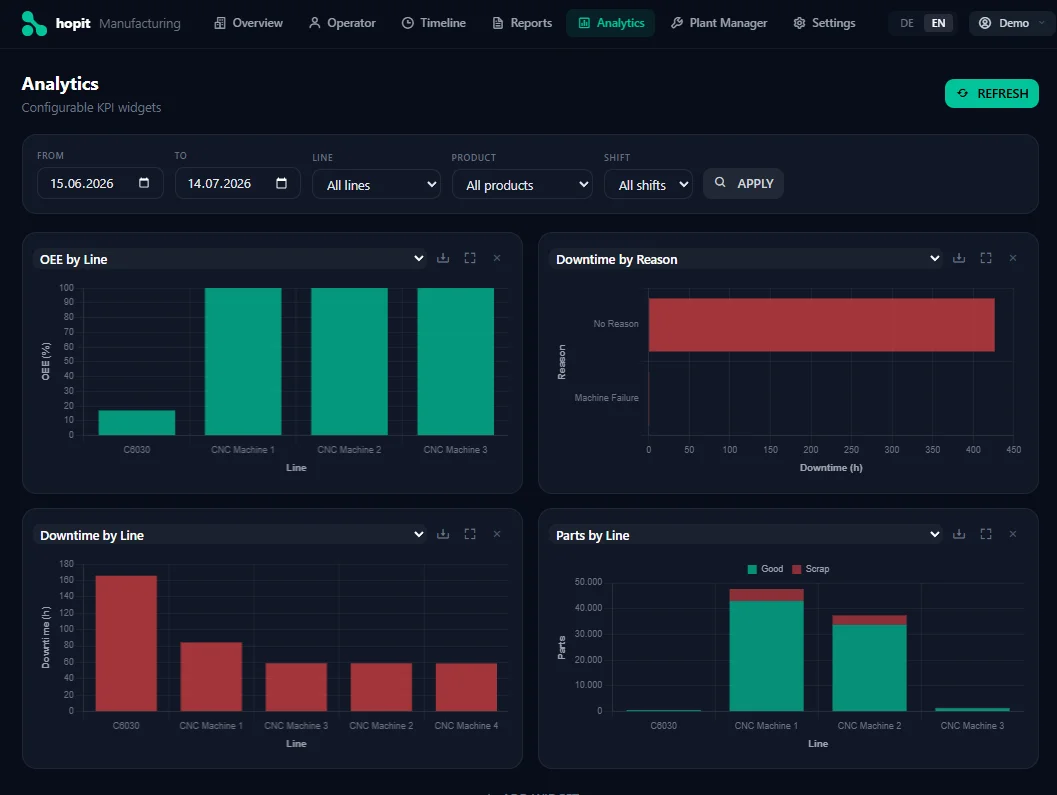
OEE Reporting & Trends
Compare OEE across lines, shifts and time periods, and export reports for management reviews, Lean/Six Sigma projects or customer audits.
- ➔ Fair benchmarking: Compare shifts and lines on consistent, automatically-collected data.
New to OEE?
Learn the formula and calculate your own baseline OEE with our free interactive calculator — then come back to see how hopit automates it.
Try the Free OEE CalculatorWhy Manufacturers Choose hopit's OEE Software
Purpose-built for small and medium-sized manufacturers in the metal and plastics industry across the DACH region.
Increase OEE, Not Just Measure It
Surface the top loss reasons per machine so improvement efforts target what actually moves the number.
One Standardized OEE Calculation
No more spreadsheet-to-spreadsheet drift — every line and shift is measured the same way, automatically.
Live, Not Just Historical
See today's OEE as it happens on any browser or panel PC, instead of waiting for tomorrow's report.
Fair Benchmarking Across Shifts
Compare machines, lines and shifts on the same automatically-collected data — no more disputes over whose numbers are right.
Eliminate Manual OEE Spreadsheets
Free up hours per week that used to go into reconstructing OEE by hand from paper logs.
Local Support Across the DACH Region
Onboarding and support in German and English, for manufacturers in Austria, Germany and Switzerland.