
What's Inside the Template
A six-sheet workbook built for the shop floor. Enter shift and production numbers on one sheet, and Availability, Performance, Quality and OEE calculate themselves on the Dashboard — no macros to enable, no setup required.
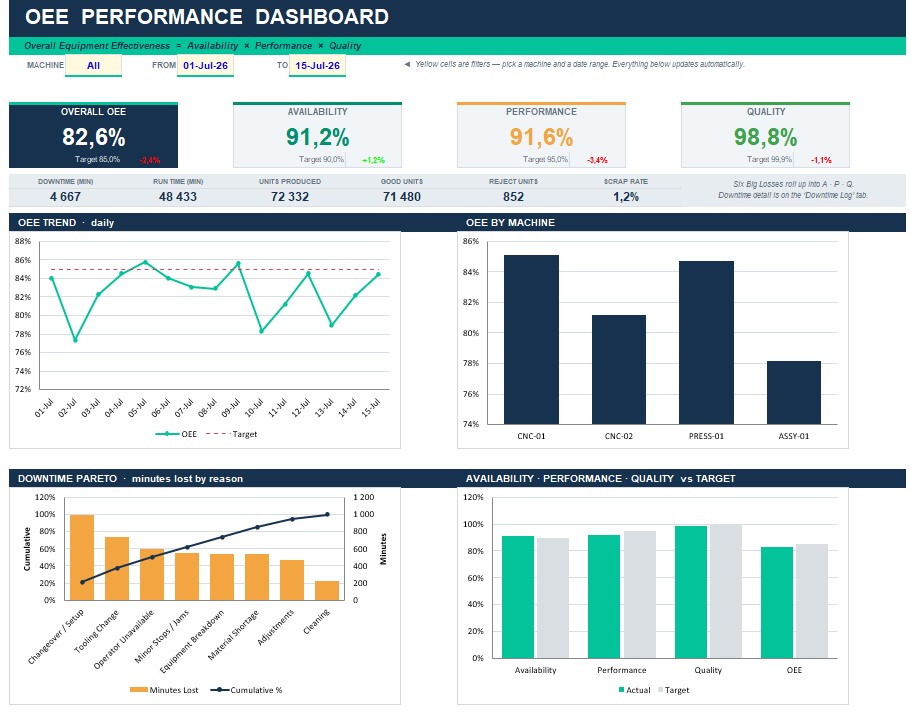
- Dashboard: Filter by machine and date range — every KPI tile and chart updates instantly. Shows Overall OEE, Availability, Performance, Quality, downtime, run time, units produced, good units, rejects and scrap rate, plus an OEE trend, OEE by machine, a downtime Pareto, and Availability/Performance/Quality vs. target.
- Data Entry: One row per machine, per shift, per day. Enter shift length, planned breaks, ideal cycle time, total units and rejects — downtime, run time and all four OEE metrics calculate themselves.
- Downtime Log: One row per stoppage — date, machine, shift, reason and minutes lost. Feeds the Dashboard's downtime Pareto automatically.
- Settings: Define your machines, their ideal cycle times, shift names, downtime reason codes and OEE targets once — they populate every dropdown in the workbook.
- Instructions: A step-by-step guide and the exact formulas used, so you can verify every number yourself.
Built on the Real OEE Formula
Every calculation matches the standard definition: Availability = Run Time ÷ Planned Production Time. Performance = Theoretical Run Time ÷ Run Time, where Theoretical Run Time is Ideal Cycle Time × Units. Quality = Good Units ÷ Total Units. OEE = Availability × Performance × Quality. Totals are time-weighted — summed, not averaged — so combining shifts of different lengths still gives the right number, not a skewed one. See the full OEE guide for a worked example, or the free OEE calculator if you just need a single quick number.
Default targets are set to the commonly referenced "world-class" benchmarks — OEE 85%, Availability 90%, Performance 95%, Quality 99.9% — sourced from Nakajima and SEMI E79. Replace them with your own plant's targets on the Settings sheet.
Ready to Track Your OEE?
Download the free dashboard and start logging your first shift today.
By submitting you agree to receive occasional emails about OEE tracking from hopit. Unsubscribe anytime. See our Privacy Policy.
Where a Spreadsheet Reaches Its Limit
The dashboard is only as good as what gets typed into it. Two gaps remain, no matter how well-built the template is:
- Entry is manual and after the fact: Someone still has to type in shift totals and downtime reasons — usually at the end of the shift, from memory.
- Micro-stops don't make it into the log: A 15-second jam is real Performance loss, but nobody writes down twenty of them a shift — so your Performance number looks better than it actually is.
Read the full OEE guide for how Availability, Performance and Quality fit together, or see how automatic OEE tracking software fills in this same dashboard live, straight from the machine.