
Machine timeline
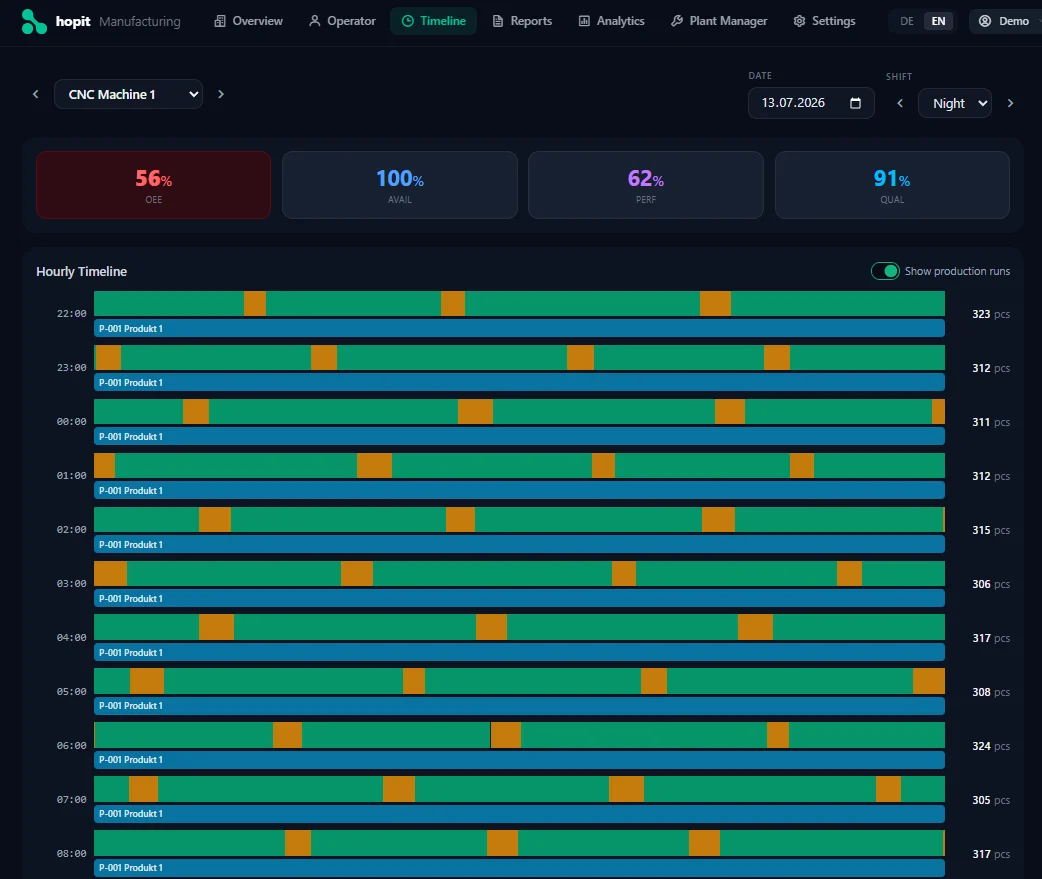
A chronological record of every running and stopped period — with reason codes overlaid, duration precise to the second, and a complete picture of where the shift was lost.
Use Case
Paper logs capture what operators remember at shift end — not what actually happened. How hopit Manufacturing detects every stop automatically, captures the cause in seconds, and turns downtime into data you can act on.
Downtime by Reason
Last 30 days · all machines · 1,000 min total
2 causes = 80% of all downtime
minutes lostThe problem
Paper-based downtime tracking is always incomplete, always reconstructed, and never detailed enough to drive maintenance decisions.
01
A 3-minute stop at 11:40. A 5-minute stop at 14:15. Neither makes the shift log because neither felt significant at the time. By Friday, those stops have added up to hours of lost production that never appeared in any report — and never will.
02
At the end of a 10-hour shift, operators write what they think caused the stops — not what actually did. "Machine fault" covers everything from a tooling issue to a material problem to a PLC alarm. That level of detail is useless for root-cause analysis.
03
Everyone knows machine 4 "breaks a lot." But without structured stop data sorted by production time lost, maintenance can't tell management which failure type to fix first — or build the business case for doing it.
How it works
hopit Manufacturing reads the machine state in real time. The moment a machine stops, a downtime event is created with a precise timestamp. The operator adds a cause. The data is immediately structured, searchable, and feeding the analytics.
A chronological record of every running and stopped period — with reason codes overlaid, duration precise to the second, and a complete picture of where the shift was lost.
Every stop this shift — total count, total time lost, and the top cause, updated continuously.
Stops this shift
7
Total downtime
1h 43m
Top cause
Tooling
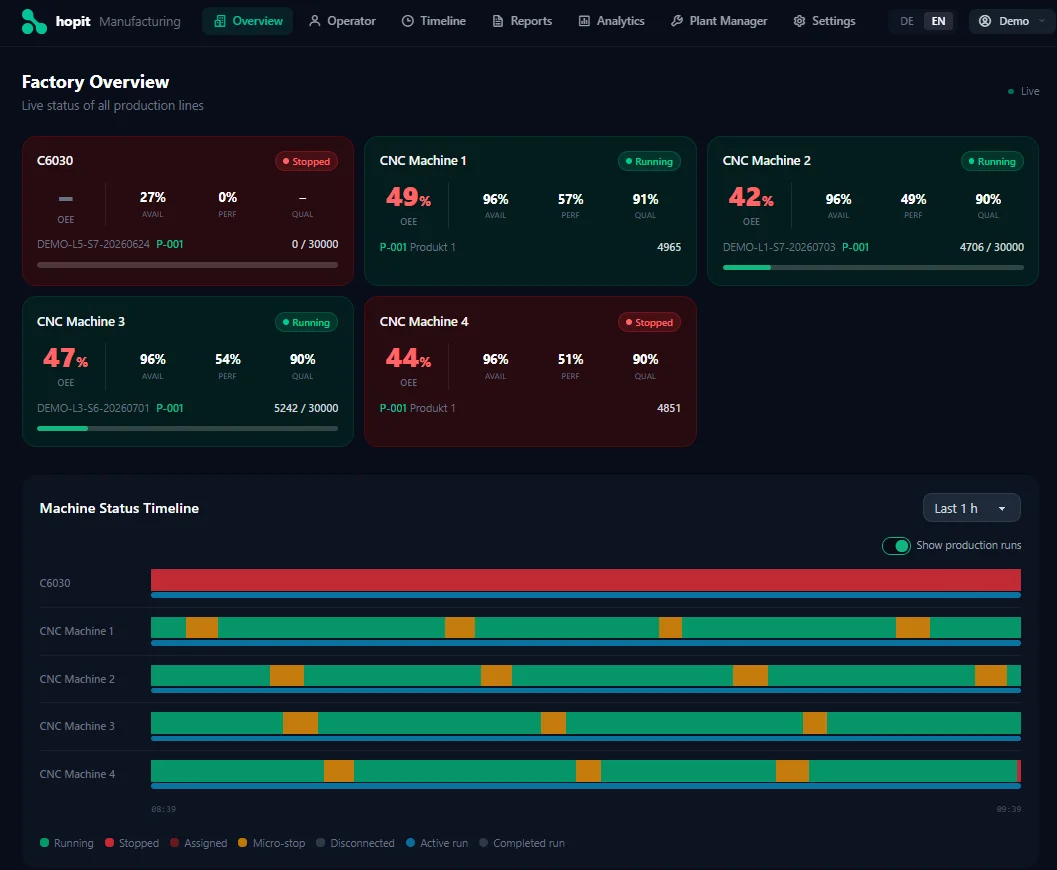
See which machines are running and which are stopped — and for how long — updated every few seconds across the whole plant.
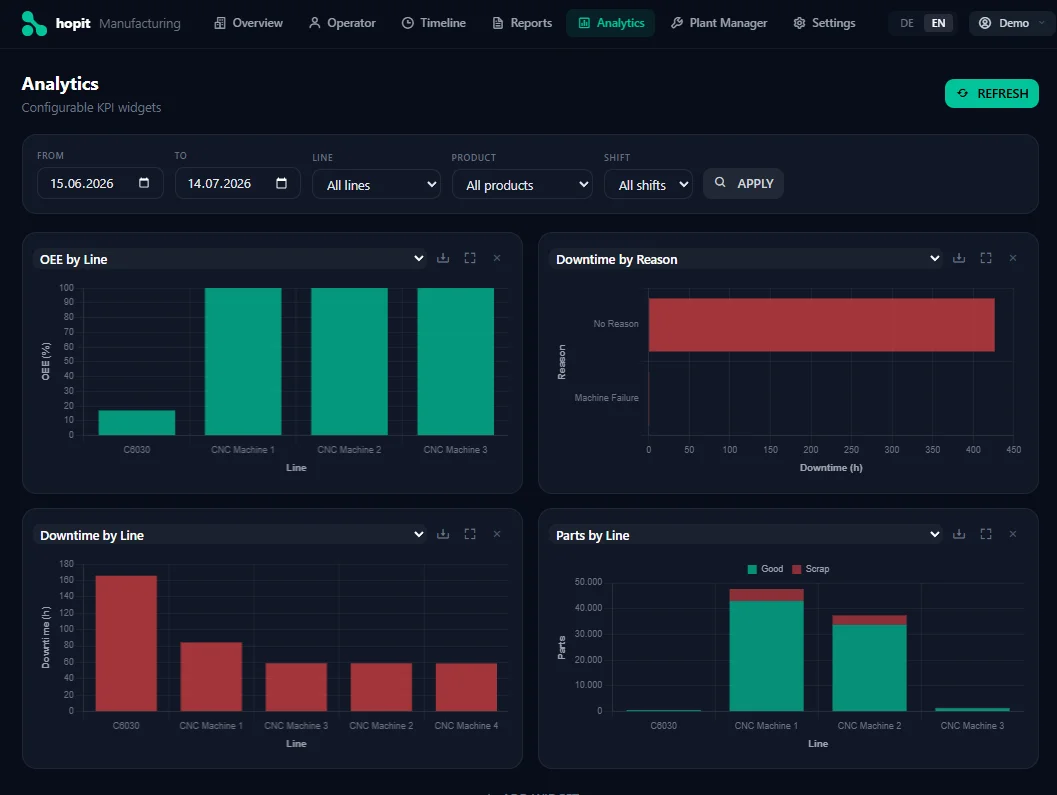
Rank stop causes by total production time lost — by machine, shift or period. The Pareto that turns "it breaks a lot" into a documented case for action.
Try our free online demo — the same dashboards, live.
TRY OUR FREE DEMOFeatures and what they change
Automatic stop detection — every stop recorded, including the short ones that never make the paper log. hopit sees the machine state change the moment it happens — not when someone writes it down.
Reason codes confirmed in seconds — operators tap a cause on the shop floor while the context is fresh, not reconstructed at shift end. Structured data instead of free-text memory.
Pareto by cause, machine and shift — rank which failure type is costing the most production time so maintenance works on what matters, not what's most visible. Filter by any time period and export for reviews.
Complete stop history per machine — know whether "it breaks a lot" is a recurring bearing failure or an operator training issue, with timestamps and durations to back it up. The data that makes a replacement or overhaul case undeniable.
Planned downtime separated — maintenance windows and scheduled changeovers excluded from the Availability calculation so OEE reflects unplanned losses only.
Who it's for
Plant Managers & Operations Directors — need to know what downtime is actually costing them, in production hours by cause, to make maintenance investment decisions with numbers behind them.
Maintenance Managers — need structured cause data to prioritize the backlog and build business cases for repairs, additional headcount, or machine replacements.
Continuous Improvement & Lean Leads — need a Pareto of downtime causes to focus Kaizen events and track whether interventions actually reduced stop frequency over time.
Production Supervisors — need to see which machines are currently down and for how long, so they can escalate or reassign work before the shift target is missed.
hopit is purpose-built for small and medium-sized manufacturers in the DACH region running machines or production lines. Common sectors:
Try the live demo to see what structured downtime data looks like. Or talk to us about connecting your first machines.