
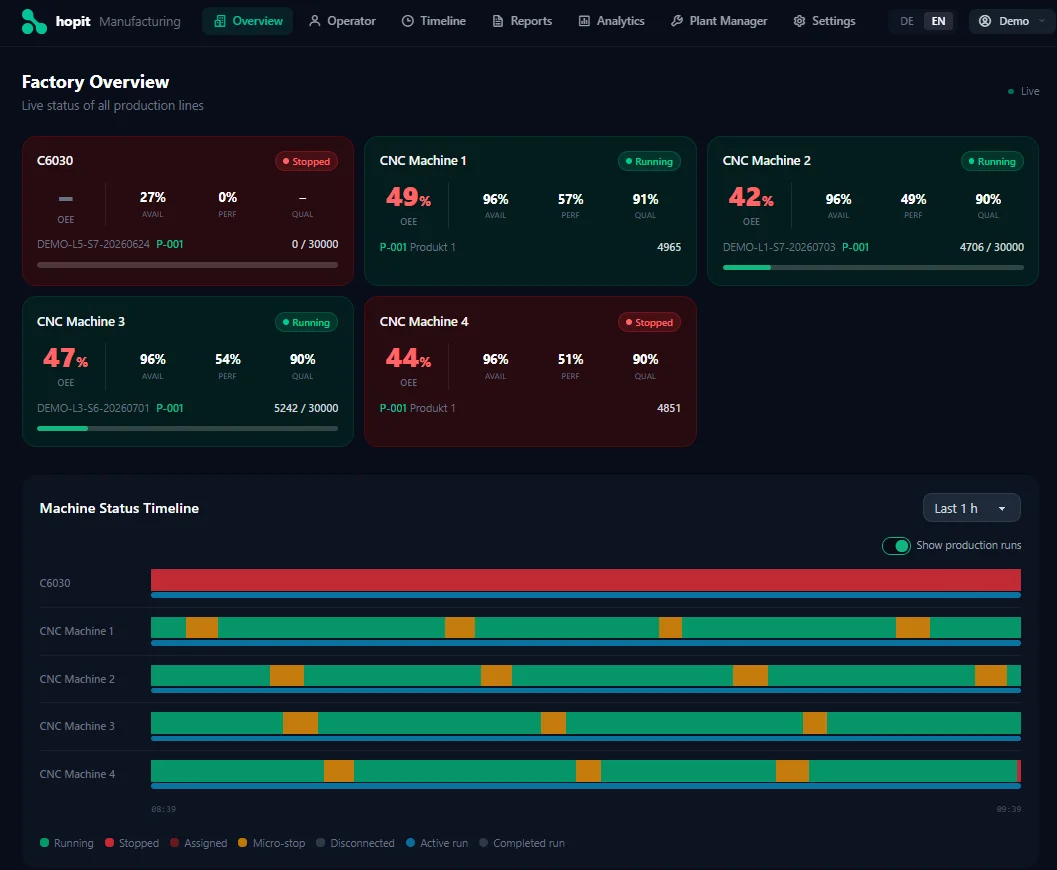
Live OEE by machine
Every machine's OEE updated in real time as the shift runs — so supervisors know which line needs attention now, not tomorrow morning.
Use Case
OEE calculated differently per shift, never in real time, always reconstructed from logs that missed half the stops. How hopit Manufacturing fixes that — automatically, from machine signals, across every line.
OEE Trend
Line 1 · last 8 weeks
+20 pp improvement over 8 weeks
OEE %The problem
Manual OEE is always incomplete, always late, and almost always inconsistent between shifts. The result is a number you can't trust and can't act on.
01
Shift logs get compiled the next morning. Timestamps are rounded. Shift A excludes changeovers; shift B doesn't. By the time the OEE figure reaches your inbox, the loss it describes is already locked in — and the methodology debate has already started.
02
Micro-stops under 2 minutes never appear in a log. A machine running at 75% of its rated speed looks fine to anyone walking past. A quality defect cluster that started at 14:00 shows up in tomorrow's scrap report. These losses are consistent, repeatable — and fixable, if you can see them.
03
The average manufacturer runs at 60–65% OEE. World-class is 85%. That gap is not a machine shortage — it's recoverable capacity inside your existing equipment. A €400k machine doesn't help if your current lines are running at 58%.
How it works
Availability, Performance and Quality each have a data source. hopit reads them from the machine signal in real time, so the number reflects what actually happened — not what someone remembered at shift end.
Every machine's OEE updated in real time as the shift runs — so supervisors know which line needs attention now, not tomorrow morning.
Each factor separated — so you know which lever to pull, not just that OEE is low.
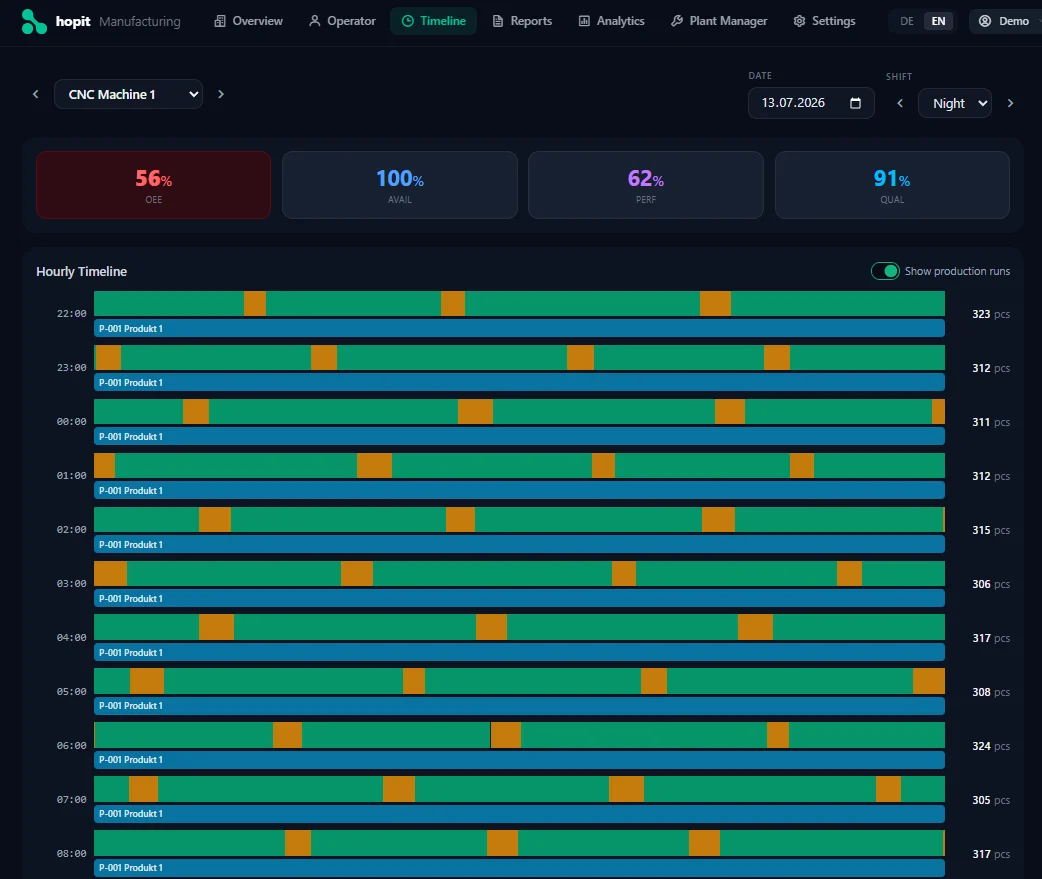
A chronological record of every stop — with cause, duration precise to the second, and how each event maps to the OEE figure.
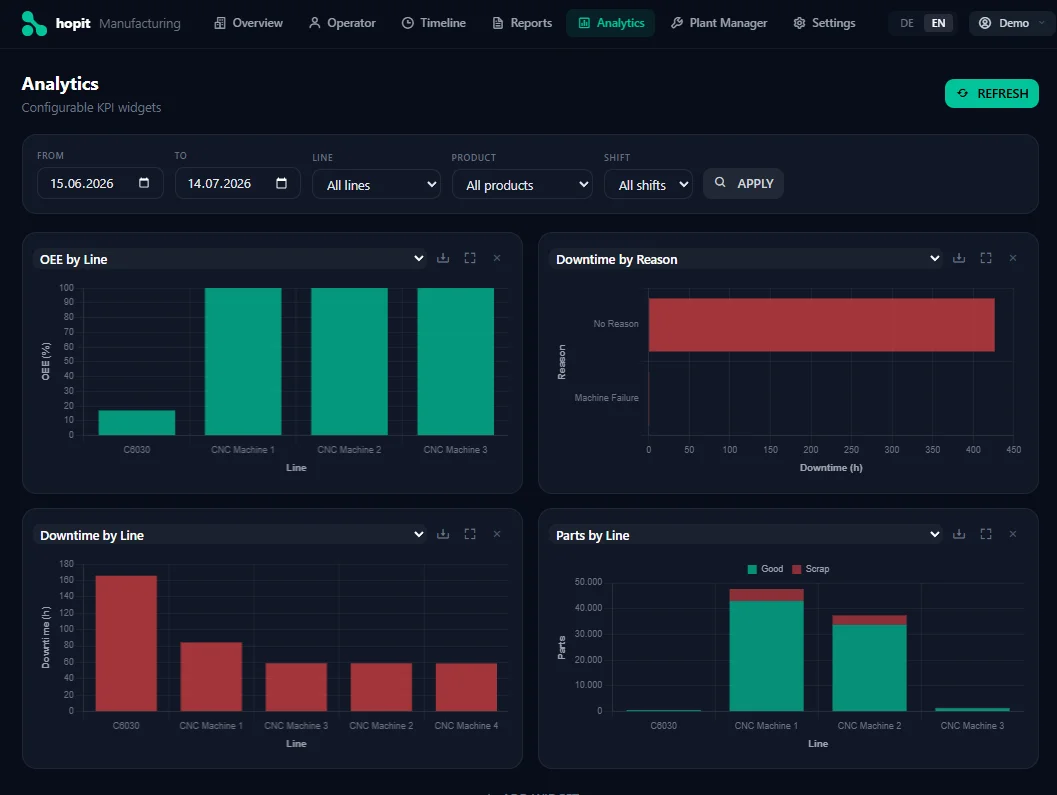
Filter by machine, line, shift or time period. All measured with the same formula — so comparing this quarter to last quarter is finally meaningful.
Try our free online demo — the same dashboards, live.
TRY OUR FREE DEMOFeatures and what they change
Real-time OEE dashboards — shop-floor visibility while there's still time to act. A supervisor who sees 58% OEE at 2 PM can still recover the afternoon. That conversation used to happen the next morning.
A · P · Q breakdown — know which lever to pull. Low Availability means downtime. Low Performance means speed loss or micro-stops. Low Quality means a process or material issue. Each calls for a different intervention.
Downtime and reason-code tracking — root-cause identification in structured form. Every stop categorized, timestamped, and ranked by the production time it cost. Over time this becomes the data that drives maintenance prioritization.
Automated data collection — eliminates manual logging errors. Machine timestamps are precise to the second. There's no human in the loop calculating or estimating — the data is exactly what happened.
Shift, line, and plant-level comparisons — benchmarking across your operation. Every data point collected the same way — so when you compare Line A to Line B, or this quarter to last, the comparison is actually valid.
Who it's for
Plant Managers & Operations Directors — need a consistent OEE number across all lines and shifts for management reporting, capacity planning, and investment decisions.
Continuous Improvement & Lean Leads — need structured loss data to prioritize Kaizen events, run root-cause analysis, and track whether improvements actually moved the number.
Maintenance Managers — need downtime data by cause and machine to justify maintenance resources and prioritize the backlog.
Production Supervisors — need real-time visibility during the shift to intervene before losses compound.
hopit is purpose-built for small and medium-sized manufacturers in the DACH region running machines or production lines. Common sectors:
Try the live demo to see what OEE looks like when it comes from the machine signal. Or talk to us about connecting your first line.